At the 'Explore Insights' page of your survey, you will find an option to filter your data. When you click on Create Filter you will see a menu that looks like this.
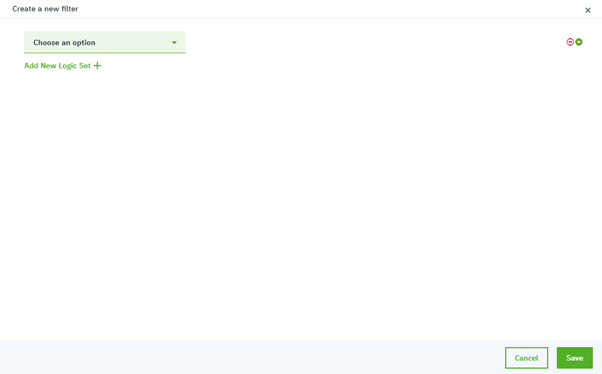
The Filter Data option allows you to create filters to view the charts with specific data of your choice only.
For example:
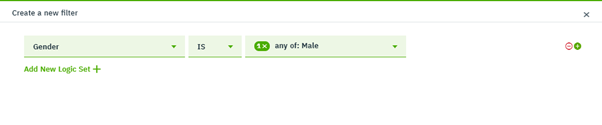
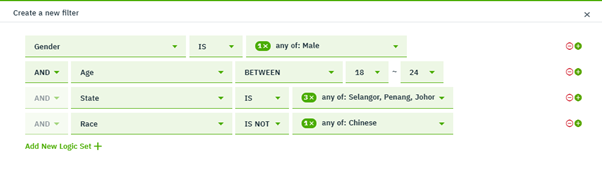
If I want the charts to only show Males, I choose Gender in the drop-down menu - Choose an option - Is - Male, and the dashboard populates the results only from Male respondents of the survey.
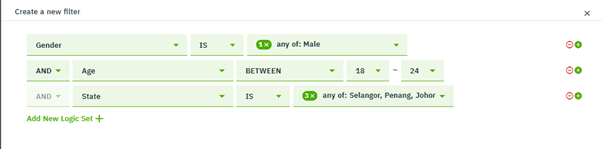
If I want additional filters added on here, I click on Add New Logic Set +. For example, I want data from Males who are between the age of 18 - 24, I choose Age - Between - 18 - 24.
If I want the charts to also specify to get from the most populated states in Malaysia (ie: Selangor, Penang and Johor). click +, choose State - Is - checkbox ticked for Selangor, Penang, Johor.
If you want to exclude Chinese now, click +, choose Race - Is Not - Chinese
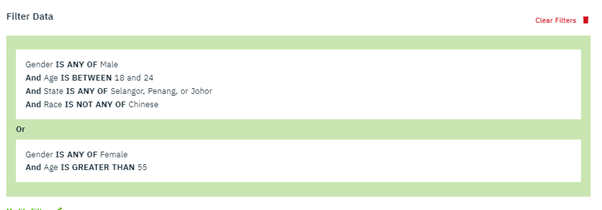
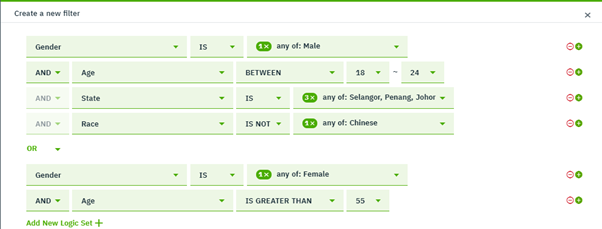
If you further want to include also the data of > 55-year-old Females, Add New Logic Set, keep OR, Gender - Is - Female - AND - Age - Is Greater Than 55
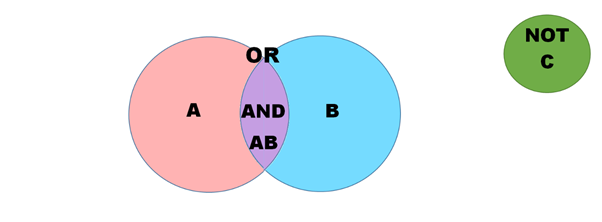
Understanding AND / OR / NOT
Once you're done, click Save, the charts will refresh showing charts with smaller sample size.
If you want to remove the filters, click on Clear Filters