![Vase Logo-4.png]](https://knowledge.vase.ai/hs-fs/hubfs/Vase%20Logo-4.png?height=40&name=Vase%20Logo-4.png)
What is the AI Report?
Once your data collection is complete, the AI Report generates a written analysis structured into six sections: a top-line verdict, an introduction to how the study was run, a profile of who responded, key findings backed by data, a deeper look at segment patterns, and actionable recommendations with trade-offs. Every number in the report traces back to a source question, so nothing is a black box.
The AI Report is currently in BETA.
When is my report generated?
For new surveys, generation starts automatically once data collection is complete. You do not need to do anything.
For surveys created before this feature launched, reports are not auto-generated. Open your survey and click Generate Analysis to run it.
When a filter is configured, the report is also not auto-generated. You will need to click Generate Analysis to run it on that specific subset. Once a report already exists, the button changes to Regenerate Analysis - use this whenever you update your context or change your filter.
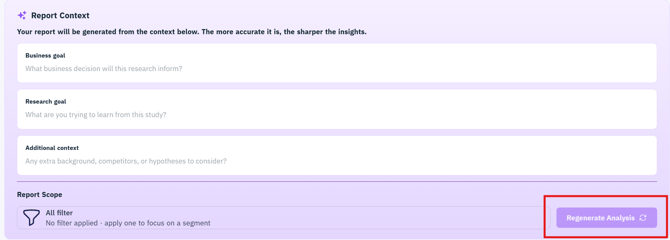
What is Report Context and why does it matter?
Report Context is the input that decides how useful your report is. The more accurate it is, the sharper the insights. Without it, the analysis can only describe what the data says. With it, the analysis can be pointed at the decision you actually need to make.
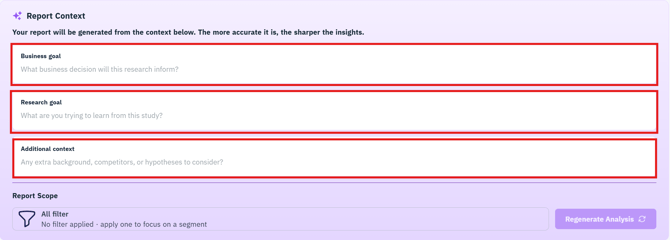
There are three fields to fill in:
Business goal. The problem your business is trying to solve using these insights - the commercial decision behind the study, not just the survey topic. A weak example would be "Understand our brand." A strong one would be "Decide whether to reposition our entry-tier product for younger buyers before the Q4 range refresh."
Research goal. The questions you have about consumers that you want the survey to answer. Write them as actual questions in plain language. A weak example would be "Brand health." A strong one would be "Do 18 to 24s see us as affordable or cheap? Which competitor do they consider first?"
Additional context. Anything else that sharpens the analysis - hypotheses you already hold, competitor information, stakeholder preferences on certain concepts, or prior wave results.
To check that your context landed correctly, scroll to the end of the At a Glance section. The report will state the decision it assumed you were making. If it does not match your actual decision, update your context and click Regenerate Analysis.
What is in the report?
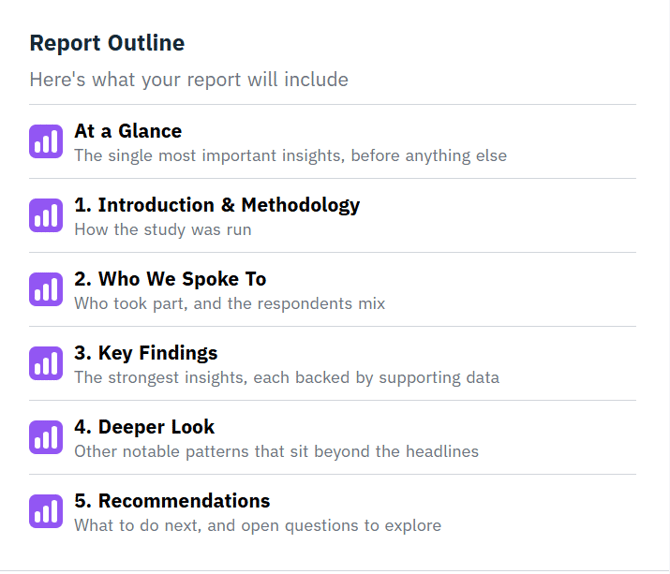
The report is structured into six sections:
At a Glance. The single most important insight from the survey. It opens with a Verdict, lists the sharpest supporting points, and closes by stating the decision the report assumed you were making.
1. Introduction and Methodology. How the study was run - research objectives, survey method, market, sample size, language, target audience, and the statistical rules used to determine what counts as a real difference.
2. Who We Spoke To. Who took part and the respondent mix, including the demographic profile and what it means for reading the results.
3. Key Findings. The strongest insights, each stated as a claim and backed with supporting data points and statistical confirmation where it applies.
4. Deeper Look. Notable patterns beyond the headlines - segment differences, sub-group comparisons, and long-tail patterns.
5. Recommendations. Suggested actions based on the survey findings. Each recommendation includes the reasoning behind it, the trade-off it creates, and what to watch for in the next read.
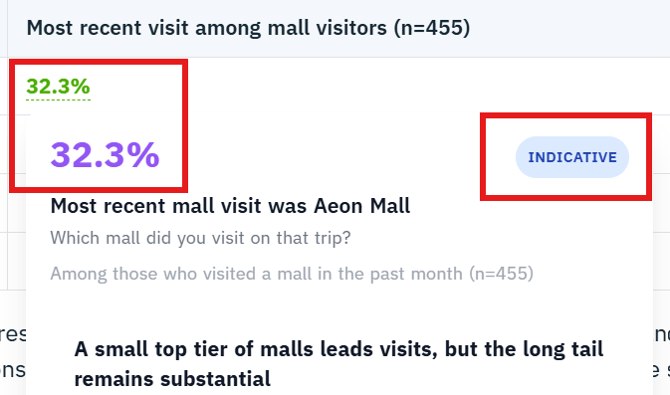
How do I check where a number comes from?
Hover over any figure in the report to see the source question it came from, the sample size answering that question, an evidence label (such as SIGNIFICANT or INDICATIVE), and the supporting chart where one exists. Always hover-check a figure before quoting it in a slide or document.
How does the report handle statistical confidence?
The report applies fixed statistical rules rather than treating everything as a finding. A difference between groups is only described as confirmed when it clears a 95% confidence threshold, both groups have at least n=30, and at least 10 people sit behind each compared result. Where a subgroup base falls under n=50, the finding is treated as directional rather than measured.
Two language conventions to be aware of when reading:
"Confirmed" means the gap passed the statistical test above - treat it as a real difference. "This suggests" signals an inference drawn across several data points rather than a single measured result - treat it as reasoning, not a statistic.
How do I analyse a specific segment?
To focus on one audience group, create a filter under Filter Data, then click Generate Analysis. You can save useful filters as Filter Bookmarks for easy access.
To compare several segments side by side at once, use Segmentation Analysis rather than running separate reports for each filter.
Always check the Report Scope line at the top of the report before quoting anything - it tells you which data the current analysis covers, for example "No filter applied" versus a specific segment.

Quick answers
-
Do I need to trigger a report for a new survey?
-
No. It starts automatically once data collection is complete.
-
-
Why does my older survey have no report?
-
Surveys created before this feature launched are not auto-generated. Click Generate Analysis to run it.
-
-
Can I get a report for just one audience group?
-
Yes. Configure a filter, then click Generate Analysis. Filtered views are never auto-generated.
-
-
I want to compare several segments at once.
-
Use Segmentation Analysis rather than generating a separate report per filter.
-
-
I updated my Report Context. Do I need to do anything?
-
Yes. Click Regenerate Analysis for the change to take effect.
-
-
Where do the numbers come from?
-
Every figure traces to a survey question. Hover it to see the question, the base, and the evidence label.
-
Still have questions?
If you have any questions about the AI Report or need help getting started, feel free to reach out to your Customer Success manager. We are happy to help.