What are suggested insights?
Suggested insights show demographic segments or segments based on other questions answered that were more likely or less likely to choose a particular answer option; or, in the case of a ranking question, more likely to rank that answer option first or last. Suggested insights are indicated by the pie chart icon. If we have prepared suggested insights for a given answer option, you'll see the pie chart icon next to its label in a bar chart.
Segment based on demographics
Segment based on other questions answered
Suggested insights are shown to you when you hover over their answer options.
How can I use suggested insights?
Suggested insights picks out segments of the audience who are more likely (or less likely) to agree with certain answer options. This serves two main purposes:
-
To check for affinity
If a certain audience segment is more likely to select an answer option, this shows affinity towards that answer option.
For example, if consumers are asked about brands they have purchased from in the past 3 months, and those from the East Coast region are more likely to have purchased from Brand A in the past 3 months, this shows that East Coast consumers have an affinity for Brand A. -
To make comparisons
The segment of the audience pointed out in the suggested insights is being compared to the total audience. When we say they are more (or less) likely to select a certain answer option, this comes from being compared to the total audience.
Taking a look at suggested insights enables a mass comparison based on demographics or answers to other questions in the survey. All answer options are evaluated to see if they appeal more to consumers from a certain segment. -
To reveal new audiences
Suggested insights can reveal underserved segments of the audience, or potential new audiences that have a particular affinity for the answer option selected.
Can you help me understand suggested insights?
Sure! Let's break down this example. We're looking at a Single/Multiple Answer question here, but this example should apply to Screener, Dropdown, and Rating Scale questions as well.
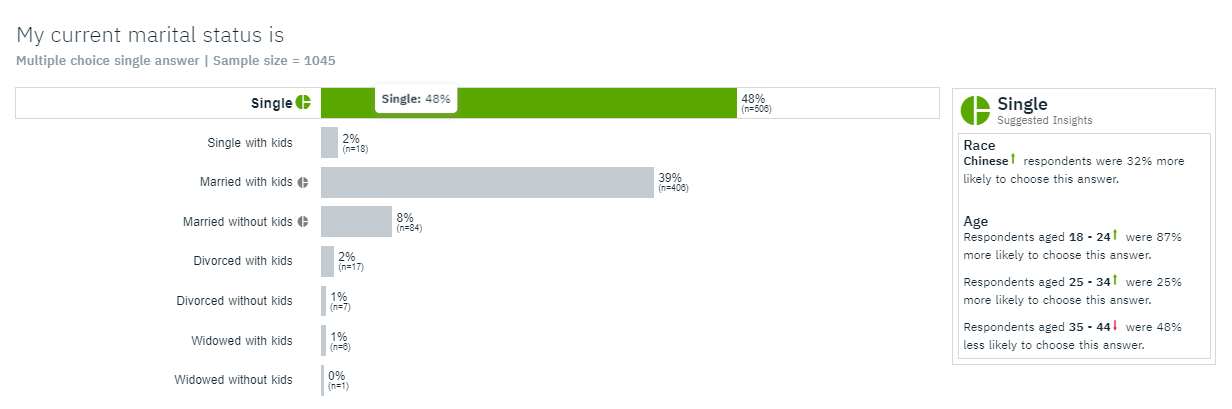
The suggested insights are shown for the answer option "Single", “Married with kids” and “Married without kids”. In this example, we will be looking at the suggested insights for “Single”, where it reads "Respondents aged 18 - 24 were 87% more likely to choose this answer".
First, let's understand the context of this suggested insight. 48% of respondents selected "Single", meaning for every 100 respondents who answered this question, 48 of them chose "Single". This is our base.
Next let's break down the suggested insight "Respondents aged 18 - 24 were 87% more likely to choose this answer". This means about 91 people out of every 100 respondents aged 18 - 24 chose "Single".
This means:
Out of total respondents: 48% selected “Single”
Out of respondents aged 18-24: 91% selected “Single”
So, respondents aged 18-24 are MORE likely to select “Single” compared to total respondents (91% vs 48%).
How much more likely? 87% more likely.
And for Ranking questions, let's look at this example.
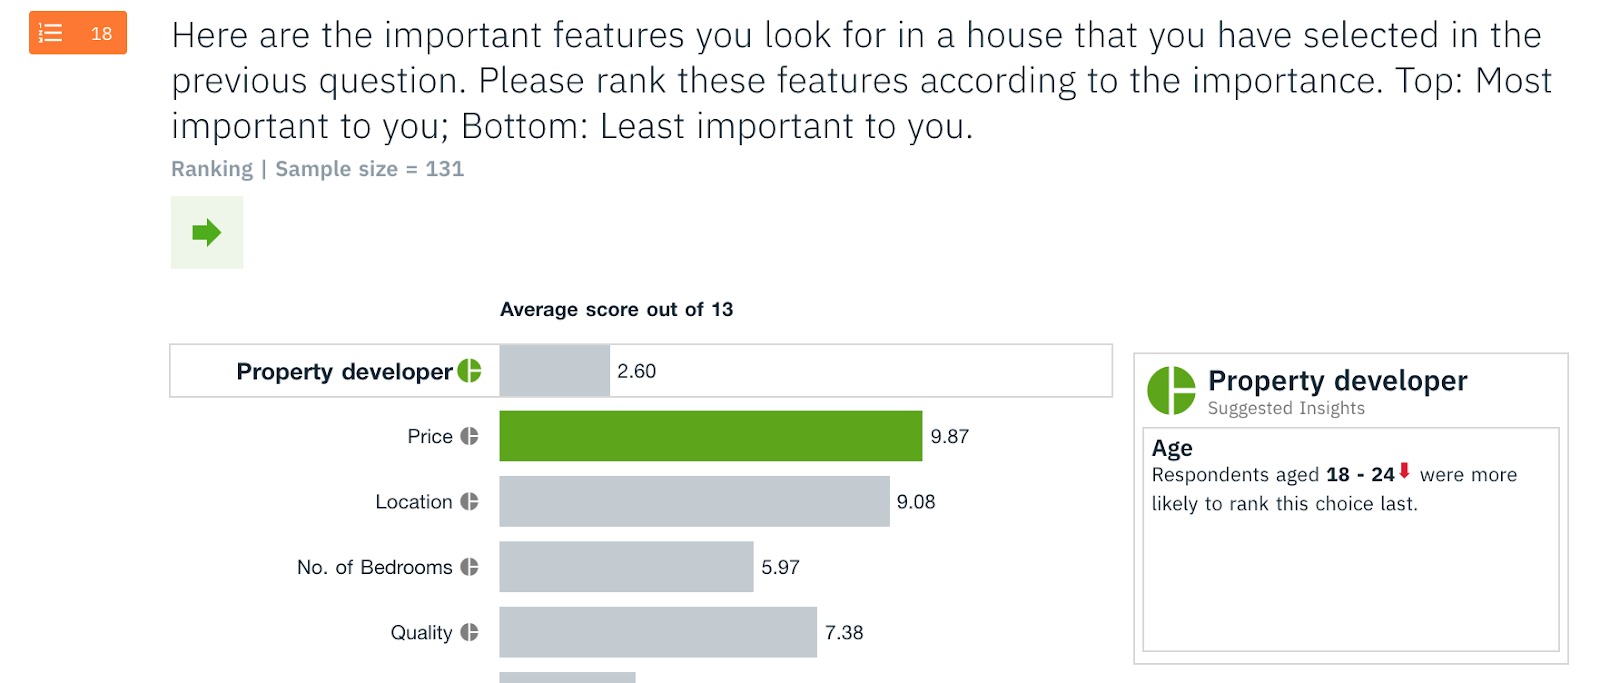
Here, we're showing suggested insights for the answer option "Property developer". Again, we're looking at respondents aged 18 - 24. It's pretty straightforward - respondents aged 18 - 24 were more likely than base to rank property developers as their last priority when answering this question - so in this scenario, a property developer is more likely to be the least important feature of a house to 18 - 24 year olds.
How do we calculate if a certain answer option is more (or less) likely to be selected by a certain audience segment?
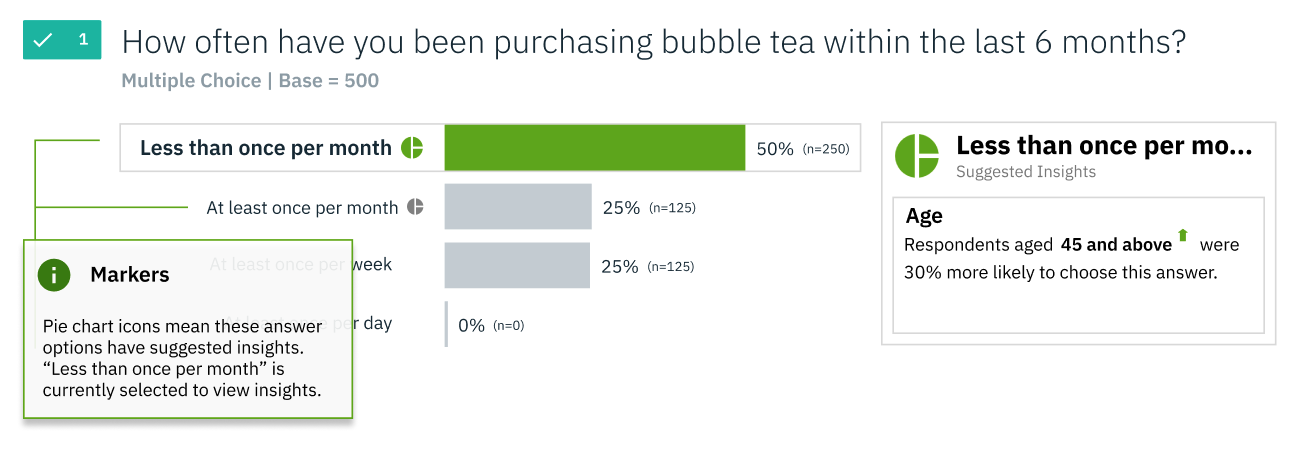
Let's break down this example. We're looking at a Single/Multiple Answer question here, but this example should apply to Screener, Dropdown, and Rating Scale questions as well.
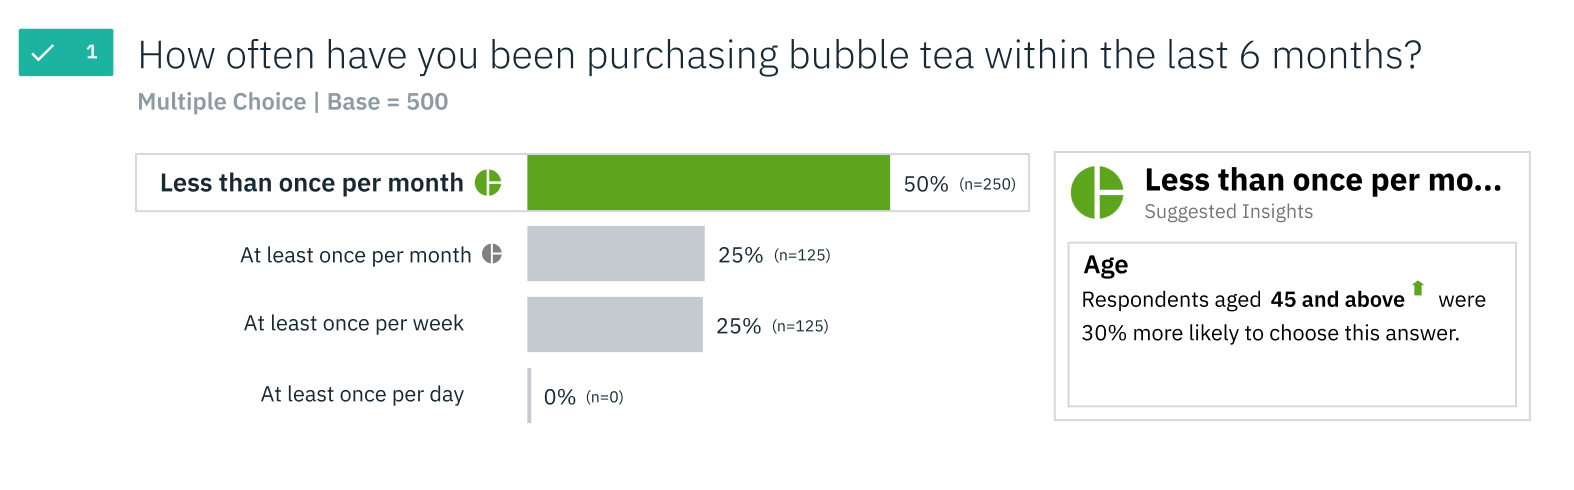
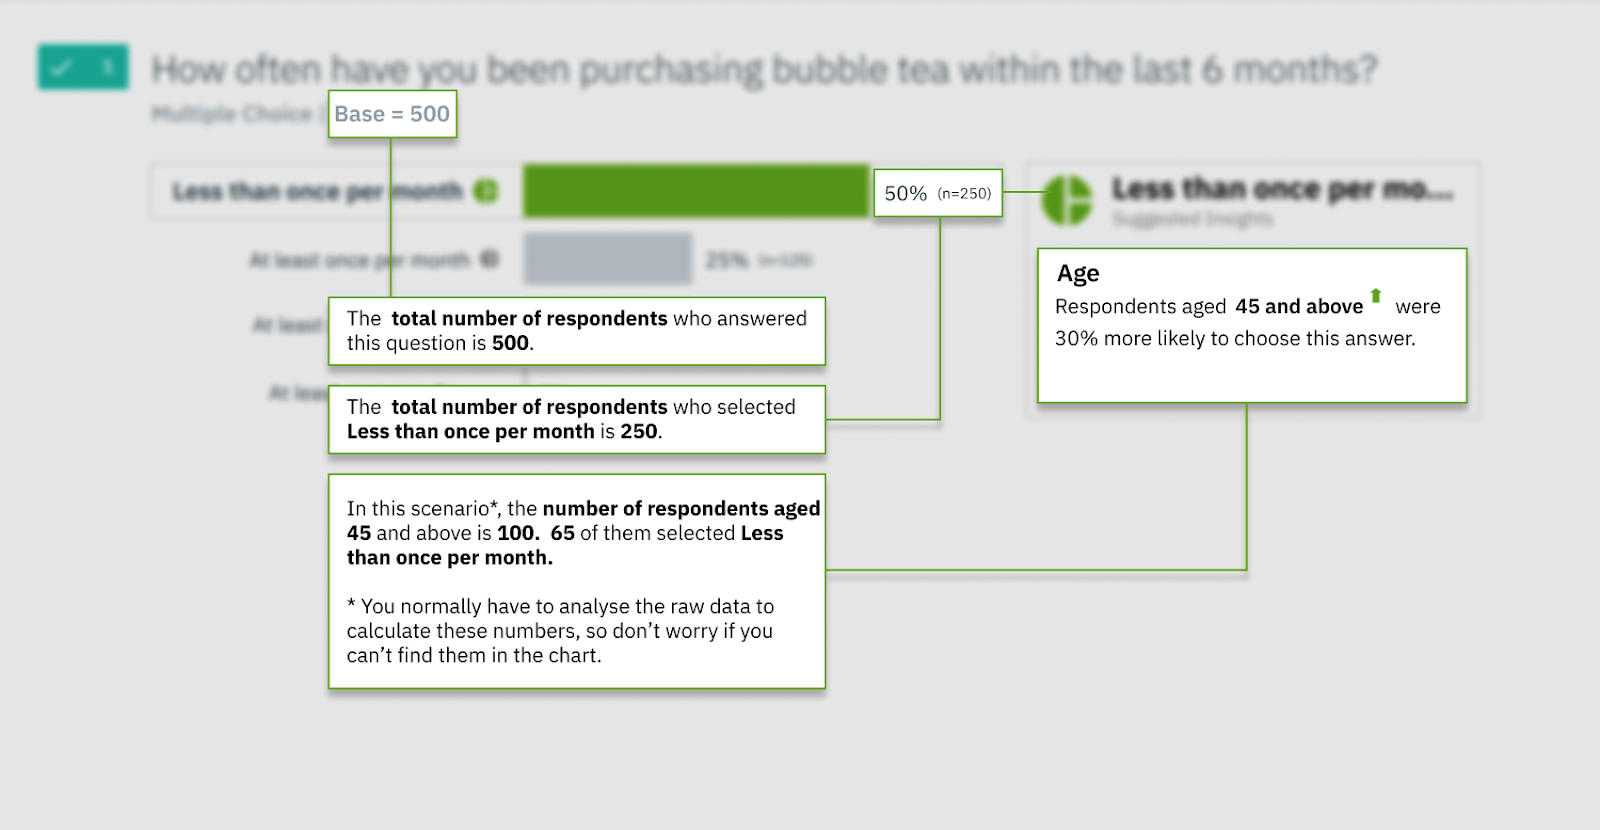
First, let's understand the context of this suggested insight. Half of the respondents (250 respondents) selected "Less than once per month". The suggested insight states that respondents aged 45 and above were 30% more likely to choose this answer. Here’s how we’ll calculate it for the example above.
To find out how much more likely respondents aged 45 and above were to choose the answer Less than once per month compared to the average respondent, we need a few things:
-
The total number of respondents
-
The number of respondents who chose the answer
-
The number of respondents aged 45 and above
-
The number of respondents aged 45 and above who chose the answer
Here’s how we find them, using the question above as an example:
With these values, we can find out the percentage of all respondents who chose the answer Less than once a month, as well as the percentage of respondents aged 45 and above who chose that answer.
| All respondents | Respondents aged 45 and above | |
| Number who chose “Less than once a month” | 250 | 65 |
| Total | 500 | 100 |
| Percentage who chose “Less than once a month” | 250 / 500 = 50% | 65 / 100 = 65% |
This allows us to calculate the difference in percentage, which is (65 - 50 / 50) * 100 = 30%. We’re done!
What segments are included in suggested insights at the moment?
If you are using your own audience, you will see suggested insights based on respondents' answers to other questions in the survey. If you have asked questions about demographics, you may be able to see segments based on demographics as well; as long as they fulfill the criteria necessary to be shown under suggested insights. Refer to the section below on "For an eligible question type, how does Vase select suggested insights to show?" to see what these criteria are.
If you are using the Vase.ai database, we show suggested insights for demographic segments based on race, gender, age, and region, as well as segments based on responses to other questions in the survey.
What question types can I see suggested insights for?
Right now, we show suggested insights for Screener, Single/Multiple Answer, Rating Scale, Dropdown, and Ranking questions.
For an eligible question type, how does Vase select suggested insights to show?
We only show suggested insights for answer options if:
-
Their question has been answered by more than 50 respondents.
-
The answer option has been selected by more than 30 respondents from that demographic.
-
The segment (either based on demographics or responses to other questions) is at least 25% more likely to select the answer option than the base, or at least 25% less likely to select the answer option than the base.
This helps us filter out less accurate insights, so that we can present you with the most meaningful insights.
Can I see suggested insights if I use my own audience?
Yes, you will still be able to see suggested insights if you've chosen to use your own audience for a survey. You will only see suggested insights from demographic segments if you have asked questions on demographics in the survey, and these demographic segments fulfill certain criteria.
Refer to the section above on "For an eligible question type, how does Vase select suggested insights to show?" to see what these criteria are.
Will I see suggested insights on the live insights carousel?
No, we only show suggested insights in the Explore Insights page.
Are suggested insights visible on surveys shared with others?
Yes, people you have shared the survey with will see the same suggested insights you see.
Do suggested insights work with filters?
No, we don't show suggested insights with filters at the moment.
Why don’t I see suggested insights?
I’m not seeing suggested insights on any survey questions
There are a number of reasons for this. We show suggested insights on the Explore Insights page, but not the live insights carousel. If you’re on the Explore Insights page, we also don’t show them if you’ve applied a filter. It could also be that none of the questions or answer options meet the criteria to show suggested insights.
It could also be that your screen is too small or resolution too low - we don’t show suggested insights when it becomes too narrow - most desktop and laptop screens should be able to see them at half screen-width or more.
I’m not seeing suggested insights on some of my survey questions
We only prepare suggested insights for Screener, Single/Multiple Answer, Rating Scale, Dropdown, and Ranking questions. Matrix and Text Entry questions will not have suggested insights. It could also be that the number of respondents who answered that particular question is below 50, or no answer options meet the criteria to show suggested insights.
I’m not seeing suggested insights for some answer options
The number of respondents that picked those answer options may be too low (less than 30), or there were no segments who were significantly more or less likely to choose that answer option.