There are two ways to download a PowerPoint report from your dashboard:
- Getting a PowerPoint report of all the data you've collected
- Getting a PowerPoint report only from a sub-segment of your survey's total audience
Getting a PowerPoint report of all the data you've collected
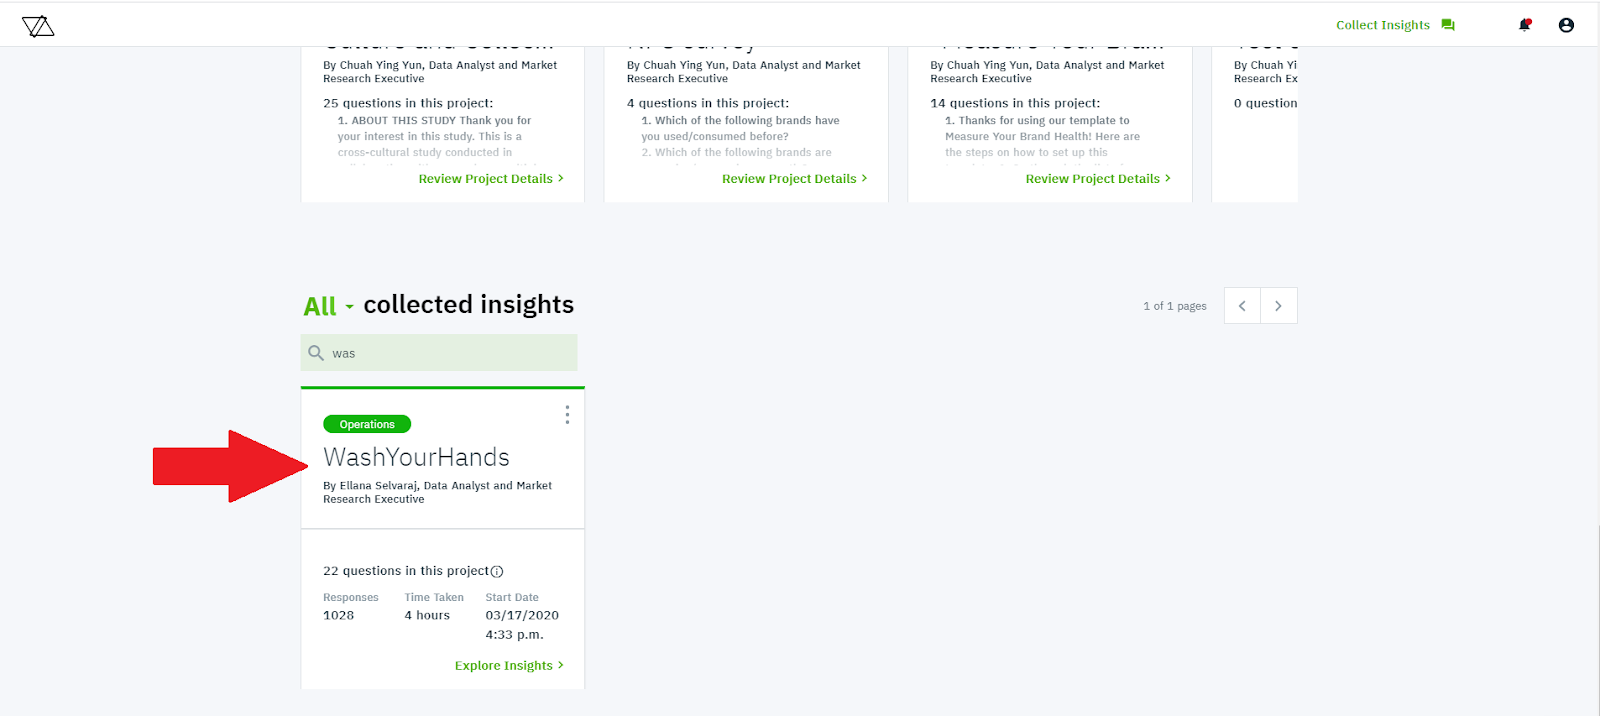
- If you'd like all your data to be reflected in your PowerPoint report, from your dashboard, scroll down to "Collected Insights" and click on the relevant study you're looking for:
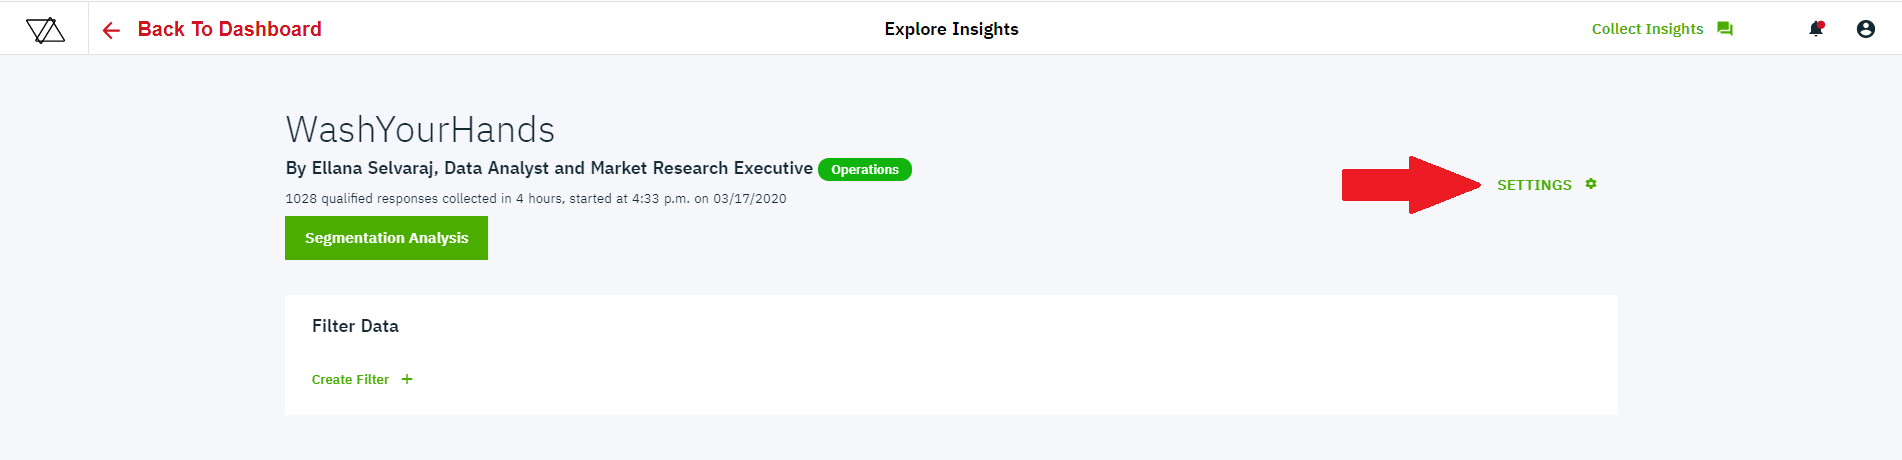
- On your study's "Explore Insights" page, click "Settings" on the top right corner of the page, as shown below:
- Select "Export PPT", and a pop-up will appear, as shown below.

- If you'd like, you can include the relevant logo and accent colour in the PowerPoint report (yours or your client's). Don't worry if you can't be bothered; no logo will appear and we will use our default accent colour.
- Click on "Download PPT" and select which folder you would like to save the file into. And you're done!

Getting a PowerPoint report only from a sub-segment of your survey's total audience
If you're interested in analysing a certain sub-segment of your audience, use our filtering tool to ensure your dashboard only shows the survey results from the audience you're interested in. Once you're done filtering, follow the same 5 steps shown above to get a PowerPoint report specific to the audience you've selected!
Here's a video showing you the steps :